V-Dem: Tracking democratic development with 30 million data points
Professor Staffan I Lindberg at University of Gothenburg is running the largest and most established democracy index in the world, V-Dem (Varieties of Democracy). He realised early on that they needed large-scale compute resources to process all the data collected annually from every country.

V-Dem ranks how democratic countries are according to five high-level principles of democracy: electoral, liberal, participatory, deliberative, and egalitarian.
With the help of some 4,200 experts in 180 countries, V-Dem tracks more than 600 variables annually for all countries. Everything, including annual reports and other publications, are available to download for free from V-Dem’s website.
Its data is used by organisations such as the UN, the World Bank, the EU Commission, USAID, and many national governments. It counts around 6,000 quotes in Google Scholar.
Increasingly used to track democratic decline
“Scientifically, the motivation behind V-Dem was – perhaps somewhat ironically – to improve the study of democracy; the transition to and strengthening of democracy,” Staffan I Lindberg explains.
“However, due to the development in the last 6-8 years, focus has increasingly shifted towards the opposite: de-democratisation and autocratisation. And this is what we have become renowned for.”
V-Dem uses an algorithm based on item response theory (IRT) models for its calculations. Originally developed for educational tests, these models have been modified by method measurement experts to suit V-Dem’s requirements.
Up to 150,000 core hours in a month
All the data is collected in January and processed during a few intensive weeks in February-March. Staffan I Lindberg says he realised early on that they needed large-scale compute resources.
“These IRT models, with raw data from more than 4,200 experts, in total some 30 million data points, are seriously demanding. You cannot run that on a souped-up desktop machine. Each variable requires from 20,000 up to 200,000 iterations. We are basically using 100,000 to 150,000 core hours in a month’s time.”
“It’s a little tricky, but it has worked very well in recent years. NAISS has been very helpful and accommodating.”
The resulting full distribution is a massive data dump – 4-5 gigabytes per variable, times 600.
“That is quite a lot to download. So we also offer 900 random draws per variable from the full distribution, which is sufficient to create a good representation.”
Uncertain future due to budget cuts
V-Dem is currently in a tight spot financially. With several grants running out, and a reduction in funding from its main sponsor, the Research Council, V-Dem has been forced to slash its budget from SEK 25 million in 2024 to around SEK 15 million for 2025.
Staffan I Lindberg says they can keep the core business – the collection and production of data – going. Thanks to an advanced infrastructure set-up, it only requires seven to eight full-time staff to run.
“What is being threatened is much of the basic research around this, first and foremost the methodological development, which is a research task, and secondly, the research itself and making it accessible.”
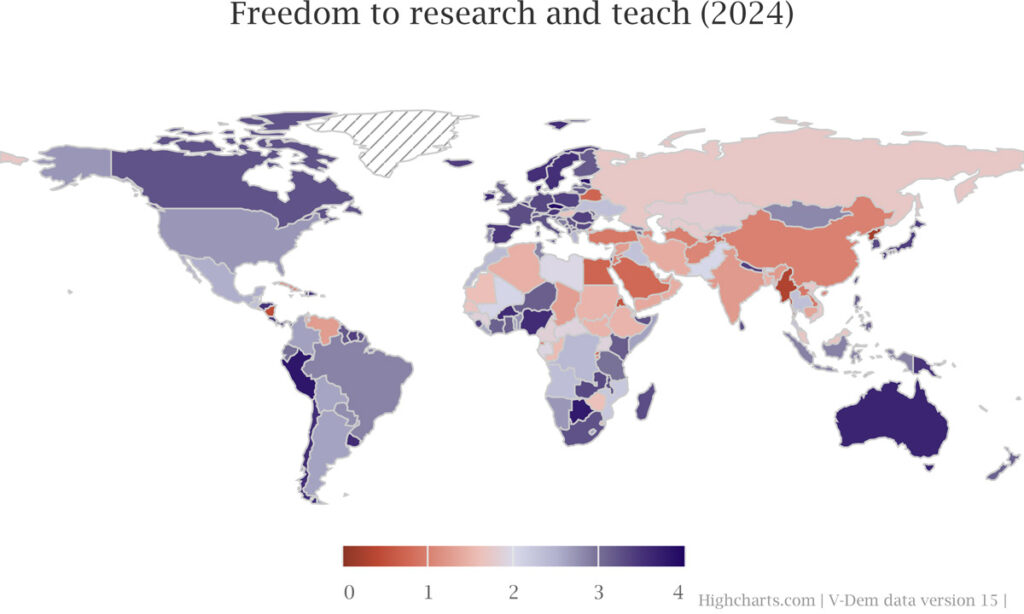
0: Completely restricted. Scholars are, across all disciplines, consistently subject to interference or incentivised to self-censor.
1: Severely restricted. Scholars are, in some disciplines, consistently subject to interference or incentivised to self-censor.
2: Moderately restricted. Scholars are occasionally subject to interference or incentivised to self-censor.
3: Mostly free. Scholars are rarely subject to interference or incentivised to self-censor.
4: Fully free. Scholars are not subject to interference or incentivised to self-censor.
Source: V-Dem